

Storefront Speed
Core Web Vitals measured from your real sessions, then root-caused per page to the specific image, script or third party responsible.
Most speed tools give you a score. A score is not actionable — "your LCP is 4.1 seconds" leaves the actual work, finding what is 4.1 seconds, entirely with you.
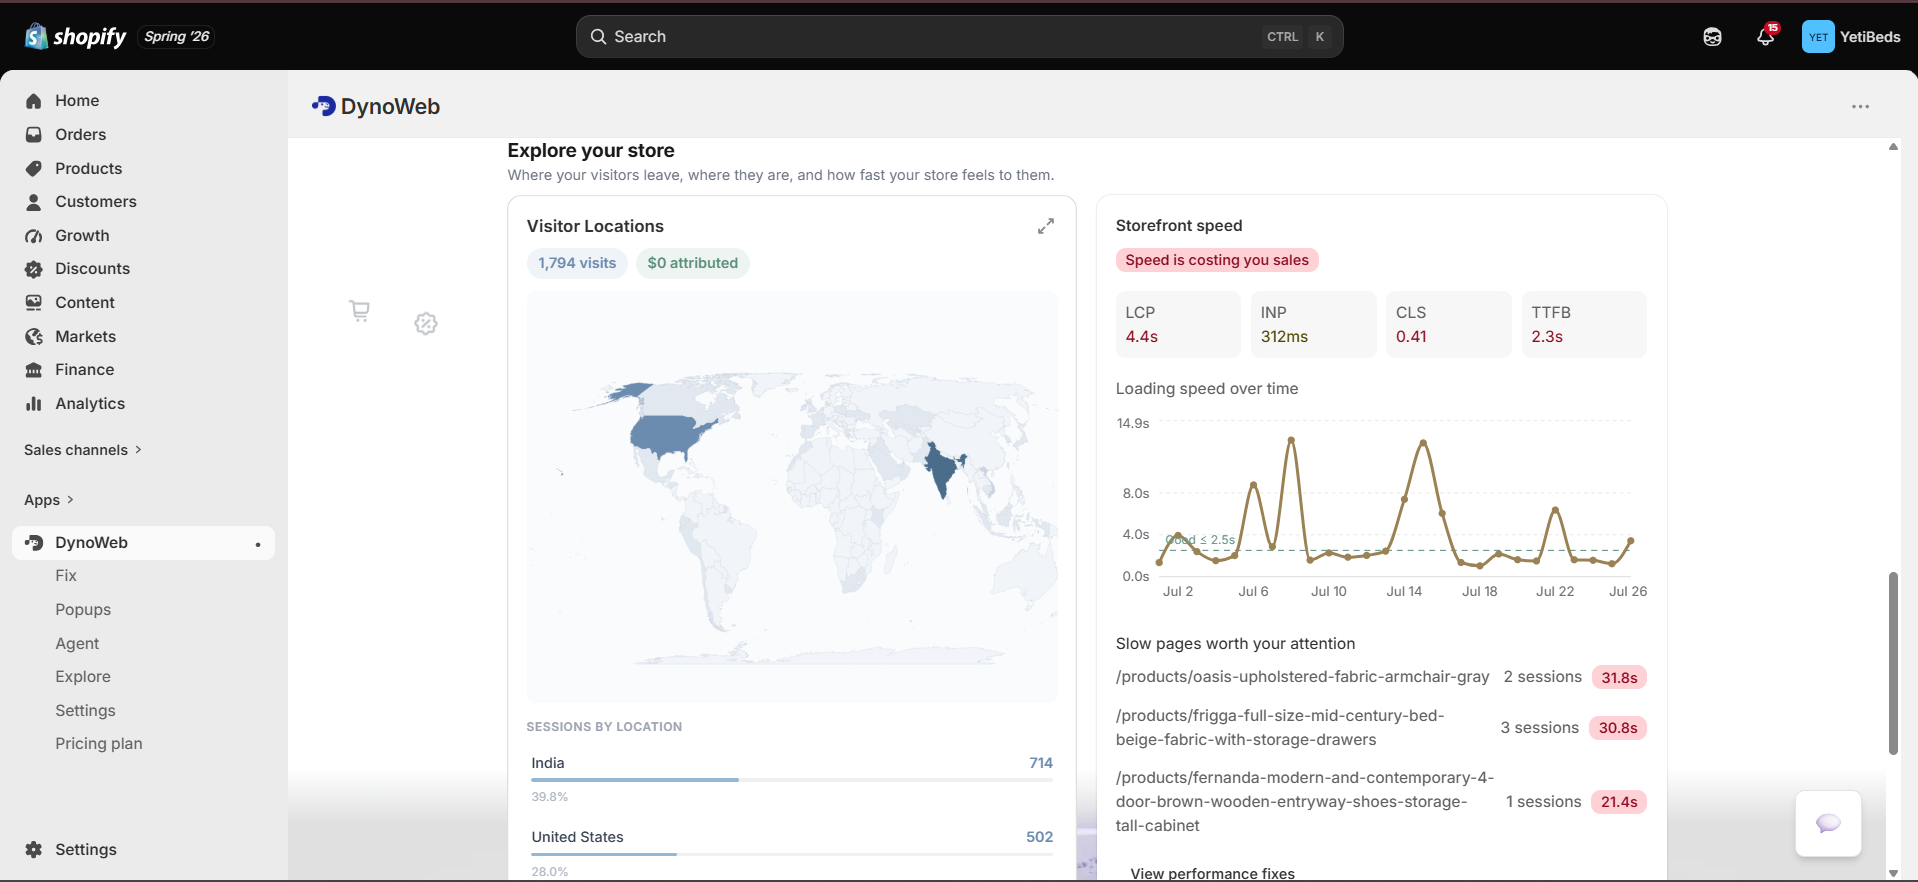
Storefront Speed does two things that together make it fixable: it measures Core Web Vitals from your own visitors' sessions, and then it runs a lab audit against your slowest revenue-exposed pages and names the culprit asset.
Field data: measured from your traffic
The tracker collects Core Web Vitals from real sessions, rated against Google's own cutoffs:
| Metric | Good | Needs improvement | Poor | What it feels like |
|---|---|---|---|---|
| LCP — Largest Contentful Paint | ≤ 2.5 s | ≤ 4.0 s | > 4.0 s | How long until the page looks loaded |
| INP — Interaction to Next Paint | ≤ 200 ms | ≤ 500 ms | > 500 ms | How long until a tap does something |
| CLS — Cumulative Layout Shift | ≤ 0.1 | ≤ 0.25 | > 0.25 | How much the page jumps while loading |
| TTFB — Time to First Byte | ≤ 800 ms | ≤ 1.8 s | > 1.8 s | Server and network before anything renders |
Each is reported as a p75 — the experience of the slowest quarter of your visitors, which is the standard Google itself ranks on and a far better guide than an average. Alongside them:
- Experience split — the share of real page loads that felt fast, okay or slow, as the recognisable three-band donut
- LCP trend — session-weighted daily p75, so a regression after a theme or app change shows up as a step in the line
- Verdict —
fast,mixed,slow, orinsufficientwhen there is not enough data to say
Field data decides whether speed is a problem; lab data decides what to do
Your visitors' real devices and networks are the only fair judge of whether the store feels slow. A synthetic audit is the right tool for finding the cause. Storefront Speed uses both, in that order.
Root cause: the audit that names the file
A daily job picks your slowest pages, weighted by revenue exposure — sales that flowed through that page — and runs each through PageSpeed Insights. Pages nobody buys through are not worth your afternoon; a slow product page carrying a third of your sales is.
From the Lighthouse result it extracts named culprits rather than generic advice:
Images
The specific oversized or unoptimised file, by filename, with a deep link into the right place in your Shopify admin — product search by handle for a product page, Collections for a collection page, Files otherwise.
Scripts
The JavaScript bundles costing the most main-thread time. On a Shopify store these are usually apps, and an extracted list is what makes an app audit possible.
Third parties
External domains — chat widgets, review apps, pixels, fonts — with their individual contribution, so you can weigh what each one costs against what it earns.
Each opportunity carries a plain-English explanation of what it is and why it matters, and the whole audit lands as a suggestion in the normal queue with a priority score — so speed work competes for your time on the same terms as everything else.
How the pieces fit
Every session contributes vitals
Web-vitals capture is part of the tracker, using the same thresholds the dashboard rates against.
Daily rollups make it queryable
Per-page performance is rolled up daily with a session-weighted LCP p75 and a session count, which is what the trend line and the worst-pages table read.
A nightly job audits the worst revenue-exposed pages
Bounded by design: a capped number of shops and pages per run, batched, so a slow audit day cannot stall the job. It needs a PageSpeed API key — without one the job is a documented no-op and the field metrics still work.
The result becomes a scored suggestion
With culprits attached and a deep link to where you fix it.
Limits
insufficientis a real verdict, not a failure. A Core Web Vitals p75 needs volume per page. Low-traffic pages will not get a rating, and manufacturing one from a handful of samples would be worse than saying so.- Lab audits are a snapshot. PageSpeed runs one page load on one simulated device. It is excellent at identifying heavy assets and unreliable as a before/after measurement — for that, use the field LCP trend, which is what Impact reads when it measures a speed fix.
- The audit is bounded per run. Only your slowest revenue-exposed pages are audited, capped per shop. It is deliberately not a full-site crawl.
- Third-party contributions are attributed, not adjudicated. DynoWeb can tell you a review widget costs 400 ms. Whether that is worth it is your call.
- DynoWeb does not edit your theme to fix speed. Speed fixes come to you with the filename and the admin link. The only writes DynoWeb makes on your behalf are the reversible Admin-API ones in SEO Autopilot.
Related
AI Suggestions
Where performance audits surface, ranked against every other finding.
Impact
Measures a shipped speed fix on field LCP p75, not on a lab score.
Revenue Attribution
The revenue-per-page figures that decide which slow page is worth fixing first.
Speed is one half of the mobile problem and rarely the half that costs most. Shopify mobile optimization covers the other half — the eleven-point gap between where shoppers arrive and where they buy, and the interaction failures that never show up on a desktop review.
Common questions
Does DynoWeb itself slow the store down?
The tracker is deferred and asynchronous so it does not block rendering. It also appears in your own attribution breakdown alongside every other script — we do not exclude ourselves from the report.
Can it uninstall apps for me?
No. It identifies the cost and the candidates; removing a Shopify app is a decision with business consequences that should stay with you.
Why does this differ from PageSpeed Insights?
PageSpeed runs a simulated load on a simulated device. This measures what your actual visitors experienced, which is the number that correlates with your actual conversion rate.
Does theme choice matter more than apps?
Often, yes — but you can only tell on your own store. The attribution breakdown shows how much of your weight is theme versus third party, which settles the question with data.
Cart Overview
Where filled carts stall — abandonment rate, per-product add-to-purchase drop-off, cart value trends, and the checkout step losing them.
AI Suggestions
Three analysis layers turn behavioural data into a ranked queue of fixes, each scored on five axes with the evidence attached — plus the full CRO Report audit.