

AI Suggestions
Three analysis layers turn behavioural data into a ranked queue of fixes, each scored on five axes with the evidence attached — plus the full CRO Report audit.
Findings are cheap. A tool that hands you twenty problems has moved the work, not done it — you still have to decide which one is worth an afternoon.
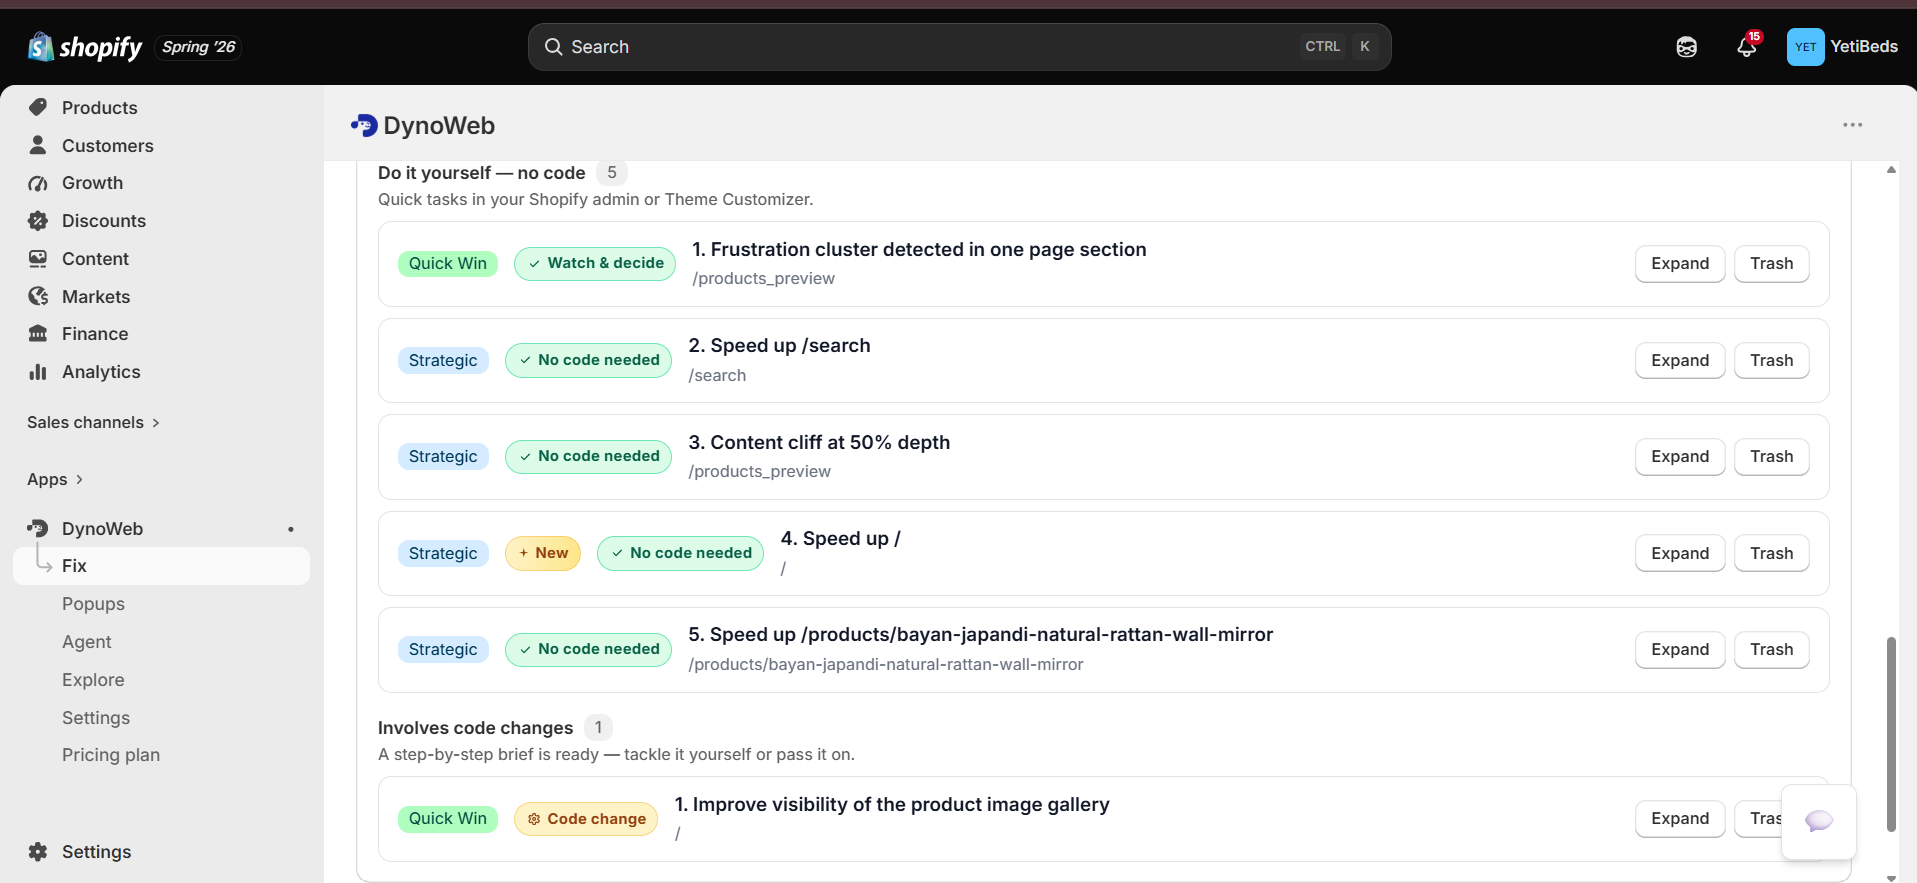
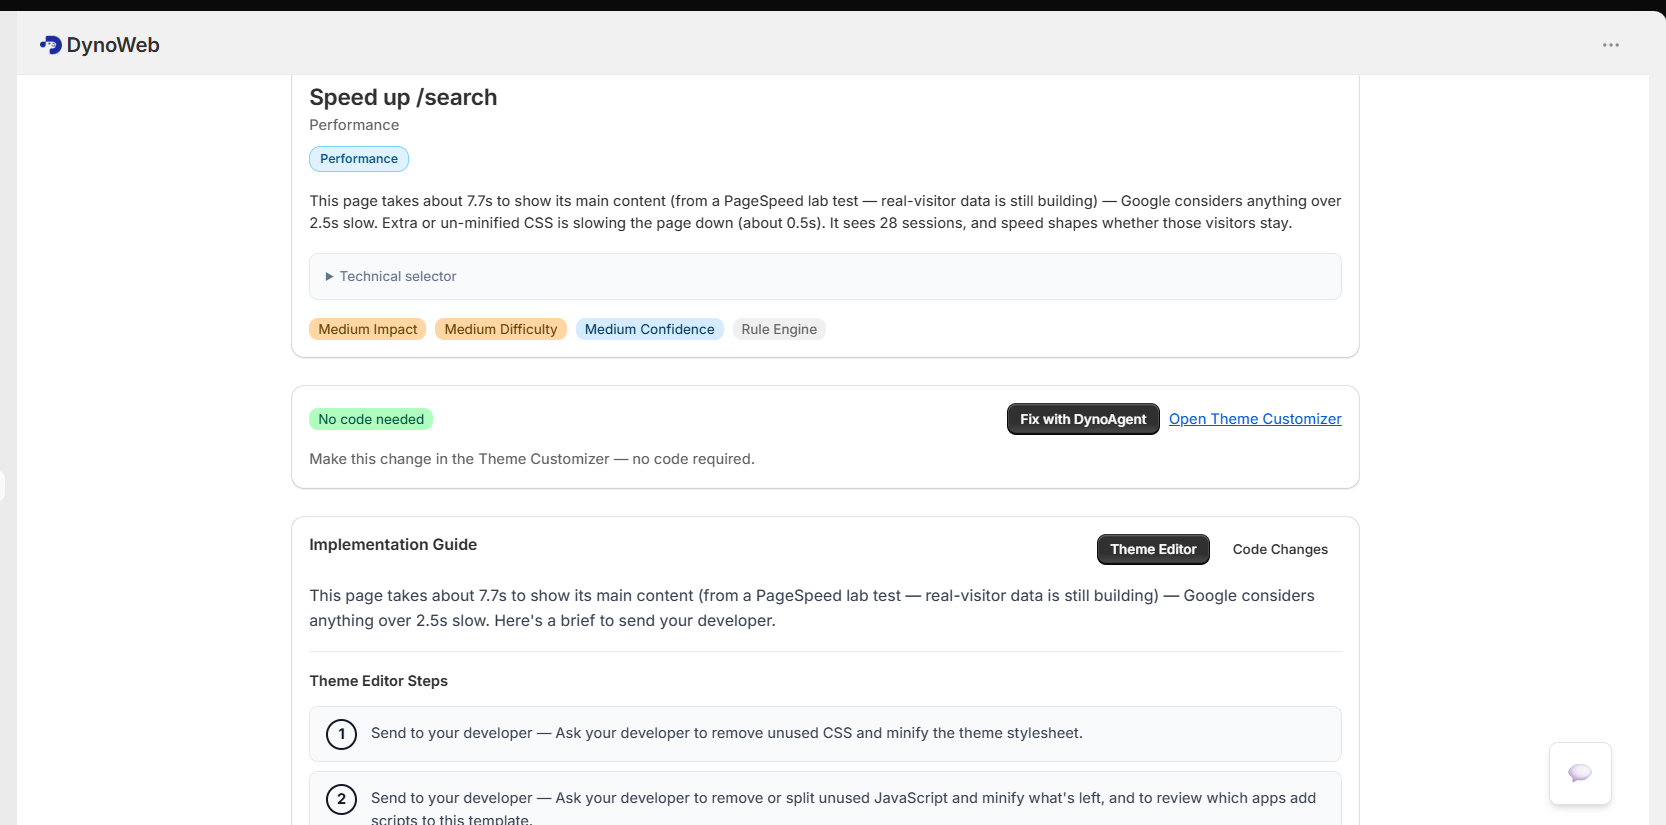
AI Suggestions is the ranking layer. Every finding arrives as a card with a concrete fix, an impact score, a breakdown of why it scored that way, and a badge telling you whether the change is safe for search rankings. Sorted, the queue answers "what should I do next" rather than "here is what is wrong".
Three analysis layers
Findings come from three sources with genuinely different characteristics, and each card tells you which one produced it.
Rule engine — instant, deterministic
Around seventeen built-in rules for UX defects that are objectively wrong, not matters of taste: tap targets under the 44px minimum, broken heading hierarchy, link contrast below accessible thresholds, primary actions below the fold, form fields that are hidden or undersized. No model involved, no waiting, no ambiguity.
Pattern detection — statistical
Anomalies and trends across your own history. Frustration clusters where many sessions rage-click the same target. Scroll cliffs where a page loses everyone at the same depth. Sudden engagement drops that indicate something broke recently. Mobile gaps where a flow works on desktop and fails on a phone. Form-abandonment concentrated on one field.
AI reasoning — deep, budgeted
A language model reads the layout and the behavioural evidence together for the findings the first two layers cannot express — things about ordering, hierarchy and copy. Bounded by a monthly cost budget, so this layer can never produce a surprise bill.
The layering is deliberate. The rules catch what is certainly wrong for free, the patterns catch what your data says is wrong, and the model is spent only on what needs judgement.
The anatomy of a suggestion
Impact score, 0–100
One number for sorting. Higher means do it sooner. It is a composite, and the composite is visible — which matters, because an opaque priority score is just a vibe with a decimal point.
PECTI breakdown
The five sub-scores behind the composite:
| Axis | Question it answers | |
|---|---|---|
| P | Proof | How strong is the evidence in your data? A cluster of 800 rage clicks scores differently from six |
| E | Ease | How simple is this to actually do? |
| C | Cost | What effort or spend does it take? |
| T | Time | How soon would you expect to see a result? |
| I | Impact | How large is the expected improvement if it works? |
Two suggestions can score 70 for completely different reasons — one because the evidence is overwhelming and the fix is fiddly, the other because the fix is trivial and the evidence is thin. PECTI is how you tell them apart, and it is why the tier badge exists.
Tier badge
Quick Win
High confidence, low effort. Do these first — they are the ones where deliberating costs more than doing.
Strategic
Meaningful improvement, moderate effort. Plan them in rather than squeezing them between other work.
Ambitious
High potential impact, genuinely complex. Worth doing, worth scoping properly first.
SEO safety badge
Marked Safe or Caution. A conversion fix that quietly costs you organic traffic is not a win, and this is the flag that stops you making that trade without noticing.
Source badge
Rule engine, pattern detection, or AI reasoning. Useful calibration: a rule-engine finding is a fact, a pattern finding is a statistical claim about your store, and an AI finding is an argument.
Status and lifecycle
Suggestions are the canonical record of "things you could do" — there is no parallel list somewhere else in the app. Each one moves through:
- Pending — in the queue
- Dismissed — archived, optionally with a reason
- Expired — the underlying evidence no longer holds, usually because the page changed
Filter by status, tier, or score. Filtering to Quick Wins is the standard opening move on a store that has never been optimised.
When you mark a suggestion done, it does not vanish — it enters Impact, which takes a baseline and comes back later with a before/after on the KPI that suggestion was predicted to move. That loop is why dismissing something with a reason is worth the extra click: it is the only signal that separates "not worth it" from "not seen".
The CRO Report
The same analysis layers, assembled into a single full-store audit you can hand to someone else.
| Section | What it contains |
|---|---|
| Revenue leak estimate | A modelled monthly range for what current UX and conversion problems are costing. The number that makes the case for doing any of this |
| Executive summary | A plain-English brief: what works, what is broken, what to do first |
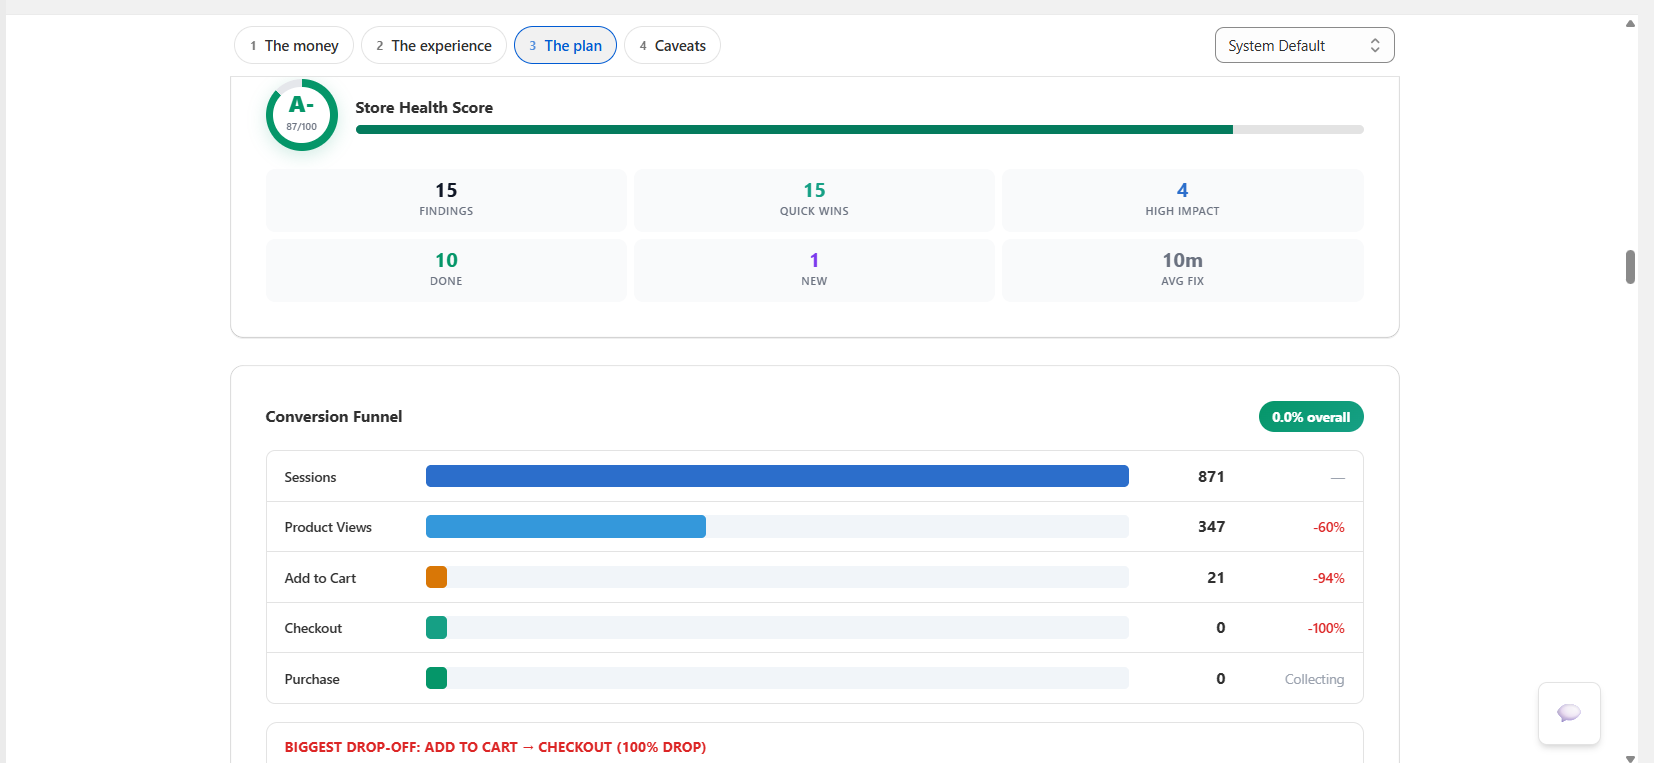
| Health score and grade | An A–F overall rating across engagement, frustration, conversion and UX quality |
| Funnel analysis | Page view → product view → add to cart → checkout → purchase, with the drop-off and estimated leak at each step, and the biggest single gap called out |
| UX scorecards | Per-page usability, engagement and frustration scores — your worst pages, ranked |
| Industry benchmarks | Your bounce rate, conversion rate, session duration and scroll depth against baselines, with the gap stated |
| LIFT model | Value proposition, relevance, clarity, urgency and anxiety — which of the five is the biggest drag |
| Prioritised quick wins | The suggestion queue, categorised by impact and effort |
| Data confidence | Insufficient / low / medium / high, based on how much data backs the report |
Generate for the last 7, 30 or 90 days. Export as a formatted PDF, or publish a public link so a co-founder or agency can read it without an account. If you have set CRO goals — a target conversion rate, a revenue target — the report tracks progress against them.
Report volume is plan-bound: Free gets one a month and only the summary, Growth four, Pro sixteen, Custom unlimited.
Read the confidence indicator first
A report generated on three days of low traffic will still produce a leak estimate and a grade. The confidence field is the label that tells you whether to act on it or wait. It exists precisely so the headline number is not read out of context.
Limits
- The revenue leak estimate is a model, not a measurement. It is a range built from your funnel, your traffic and benchmark conversion rates. It is a well-founded argument about opportunity size. It is not a number you should put in a forecast.
- Benchmarks are baselines, not peers. They are industry-standard figures, not a cohort of stores matched to your category, price point and traffic mix. A conversion rate below "average" on a £900 considered purchase is not automatically a problem.
- Proof scales with volume. On a low-traffic store, pattern detection has little to work with and the queue will lean on rule-engine findings. Those are still real — they are just generic rather than specific to your shoppers.
- AI reasoning is budgeted, so it is not exhaustive. The monthly cost ceiling is what keeps the feature affordable; it also means the deep layer looks at the highest-value findings rather than everything.
- A suggestion proposes; it does not measure itself. Predicted impact is a prediction. The only honest number arrives later, from Impact, and it sometimes disagrees.
Related
Impact
What actually happened after you shipped one of these.
SEO Autopilot
The subset of suggestions DynoWeb can apply for you, reversibly.
DynoAgent
Ask the same data questions conversationally instead of reading a queue.
Common questions
Will the AI change my store without asking?
No. Nothing is written to your theme or products without an explicit approval from you. Suggestions sit in a queue until you act on them.
How does it know how my brand sounds?
Brand DNA learns your tone, vocabulary and formatting conventions from your existing product copy, so generated text reads like your store rather than like generic ecommerce filler.
What kinds of changes can it actually make?
Product and collection copy, page structure and section ordering, image and media handling, SEO metadata, on-site messaging and offer placement, plus theme-level layout adjustments where your theme supports them.
What if a suggestion makes things worse?
Impact measures the change against the period before it, and every applied change can be reverted in one click. A losing change is a cheap experiment, not a problem.
Storefront Speed
Core Web Vitals measured from your real sessions, then root-caused per page to the specific image, script or third party responsible.
DynoAgent
A conversational analyst with read access to your store's data and gated write access — every change is previewed, approved, logged and revertible.