

Revenue Attribution
Which buttons, links and images on your store actually carry orders — per element, per page, per device, written from Shopify's own order webhooks.
You know which products sell. You almost certainly do not know which elements sell them. Is the hero banner earning its position, or is everyone converting through search? Does the sidebar newsletter block pay for the space it occupies?
Revenue Attribution answers that. When a shopper interacts with an element and later completes an order, the order's revenue is attributed back to the elements on the path, using session-level cart tracking and Shopify's own order webhooks.
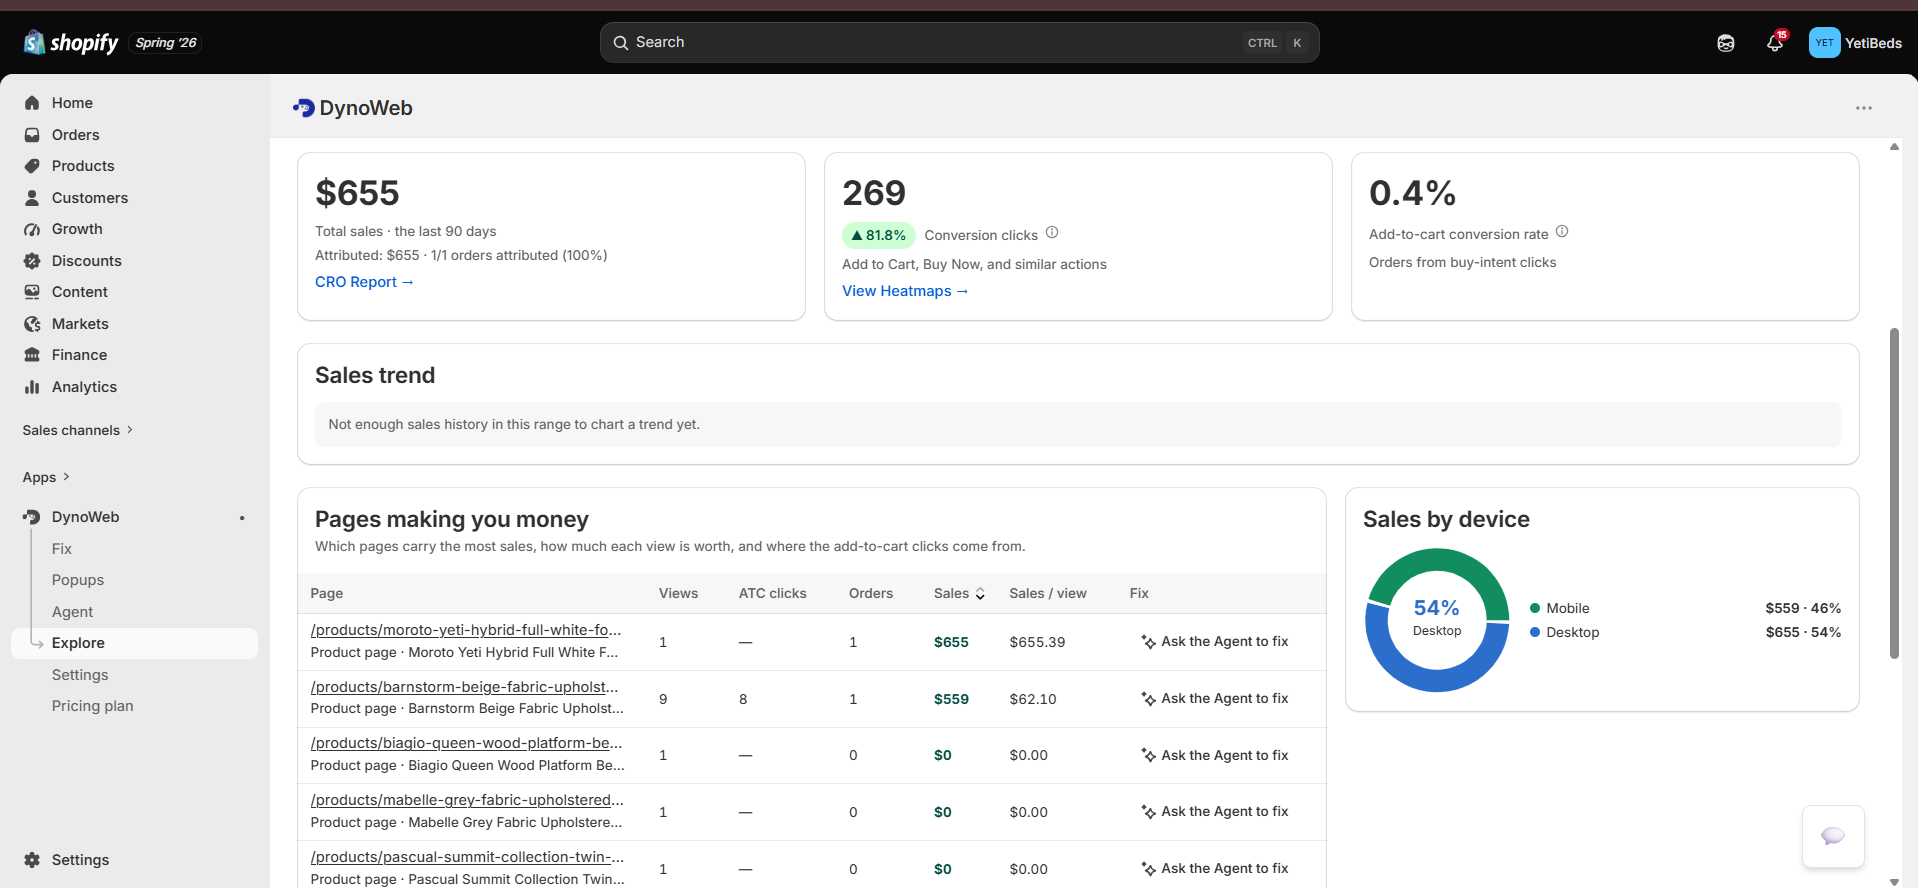
What it reports
Headline metrics
- Conversion clicks — interactions that were followed by a purchase in the same session lineage
- Order conversions — orders attributable to tracked interactions
- Revenue attributed — the money, tied to specific elements
Top converting elements
Ranked by revenue. This is the table that changes layout decisions, because it is frequently counter-intuitive: a footer best-sellers link out-earning a homepage hero is common, and it is an argument for moving the best-sellers section up rather than redesigning the hero again.
Bottom converting CTAs
High click volume, no revenue. These are the more actionable half. An element attracting five hundred clicks and zero orders is not neutral — it is consuming attention and prime layout space and returning nothing. Redesign it, move it, or remove it.
Revenue by page
Which pages carry money. This is what makes prioritisation elsewhere in DynoWeb sane: it is why Storefront Speed audits your slowest revenue-exposed pages rather than your slowest pages, and it is how you decide whether a frustration cluster is on a page worth fixing this week.
Device comparison
Desktop versus mobile conversion, side by side, on the same elements. This is where most stores find their largest single gap. An element performing acceptably in aggregate can be failing entirely on the majority of traffic.
How attribution works
Interactions are recorded against the session
Every click carries its element selector, page and device, and lands in the per-element daily rollups.
Shopify tells DynoWeb about the order
The orders/create webhook fires on every order — HMAC-verified, no setup, no
pixel to install, no tag manager. Cancellations, edits, updates and refunds have
their own webhooks so the picture stays current rather than only ever growing.
Revenue is written back onto the rollups
Attributed revenue and order counts are written onto the element and page rollups that the interactions already populated. Because attribution lives on the same rows as the behavioural data, "clicks on this button" and "revenue behind this button" are one query — which is what makes the bottom-converting table possible at all.
Ordering, not last-click
This is not a marketing attribution model competing with your ad platform's. It is a question about your own store's interface: of the things a buyer touched on the way to purchasing, which ones recur across buyers. Read the tables as evidence about layout and hierarchy, not as a channel budgeting tool — for channels, use the traffic-source reporting, which classifies direct, organic, paid, social, email and referral with UTM campaign breakdown and revenue per source.
Limits
- Correlation, in the order the shopper moved. An element on the path to a purchase is credited. That is not proof it caused the purchase — a shopper who was always going to buy still clicks the hero on the way. Read relative performance between elements, which is where the signal is, rather than treating one element's total as its earned revenue.
- Multiple elements share one order. An order touched by four elements contributes to all four. Totals across the table therefore do not sum to your Shopify revenue, and are not meant to.
- Cross-device journeys break the chain. Browse on a phone, buy on a laptop, and the phone-side interactions get no credit. This under-credits discovery surfaces systematically, so it is a consistent bias rather than random noise — comparisons stay usable, absolute figures are conservative.
- Selector-based, so a theme change resets history. Renaming a class or restructuring a section makes the old element a different element. Element history does not survive a redesign; page-level revenue does.
- Low-traffic elements are noise. Three orders behind a link is three orders, not a conversion rate. Sort by volume before you sort by rate.
- Revenue writes are owned by the order webhook, and rollup rebuilds preserve them rather than overwriting — so a backfill or recomputation of behavioural data never silently drops attributed revenue.
Related
Impact
Uses these figures as the before/after baseline for fixes on the money path.
Storefront Speed
Revenue exposure per page is what decides which slow page gets audited.
Heatmaps
Clicks per element, next to the revenue behind them — attention versus money.
Common questions
Does this conflict with my ad platform's attribution?
They measure different things. Ad attribution asks which channel brought the visit; DynoWeb asks what happened on-site once they arrived. Both can be true of the same order, and neither number is a substitute for the other.
How do you avoid double-counting across changes?
A session exposed to several changes contributes to each of their exposure sets, but the cumulative total is deduplicated at the order level so the same revenue is not summed twice in the roll-up.
Can I export this for reporting?
Yes. Attribution data exports for use in your own reporting, and is queryable through MCP Integration if you want it inside an existing BI workflow.
What about returns and cancellations?
Attributed revenue reconciles against Shopify order status, so refunded and cancelled orders are removed rather than left inflating the total.
Impact
Every applied fix is measured on the KPI it was meant to move, as a difference-in-differences against your own store trend — with honest verdicts, including "no change".
MCP Integration
A remote MCP server that puts your store's analytics and controls into Claude, Cursor or ChatGPT — 66 tools, the same approval gates as the in-app agent.