Dashboard
Learn what each area of the Dashboard shows and how merchants should use it.
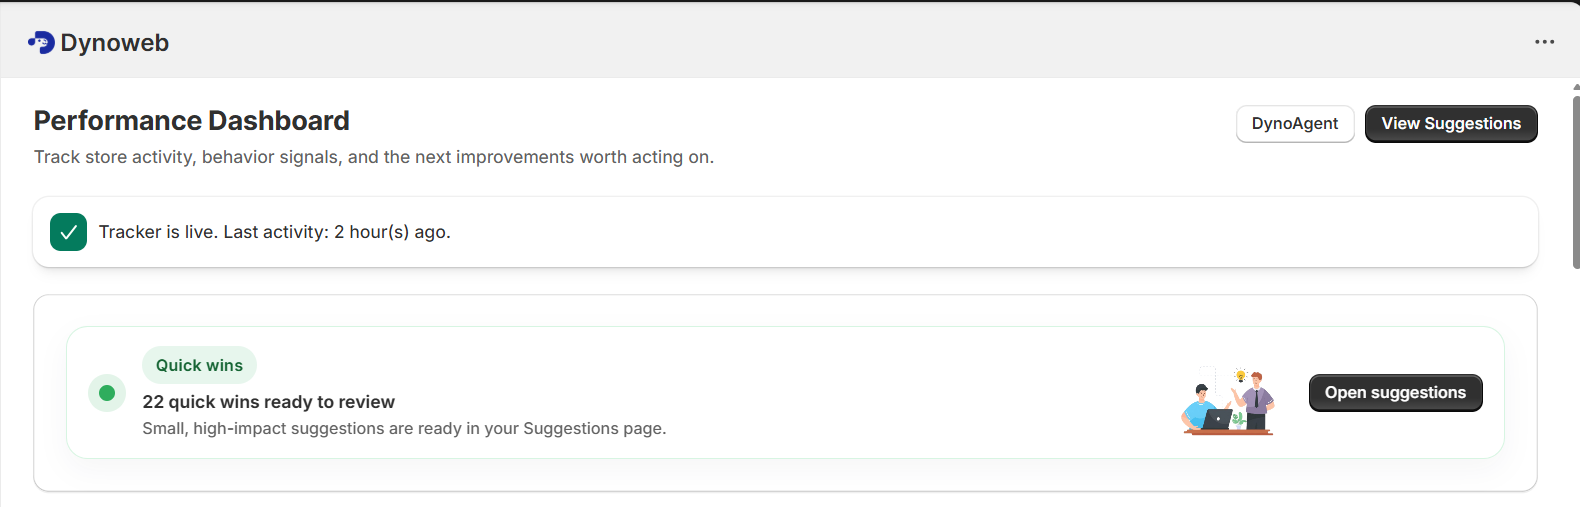
Top Of Page
This is the main dashboard entry area.
It tells users they are on the store performance overview, shows whether tracking is active, and surfaces quick wins if the app has already found suggestions.
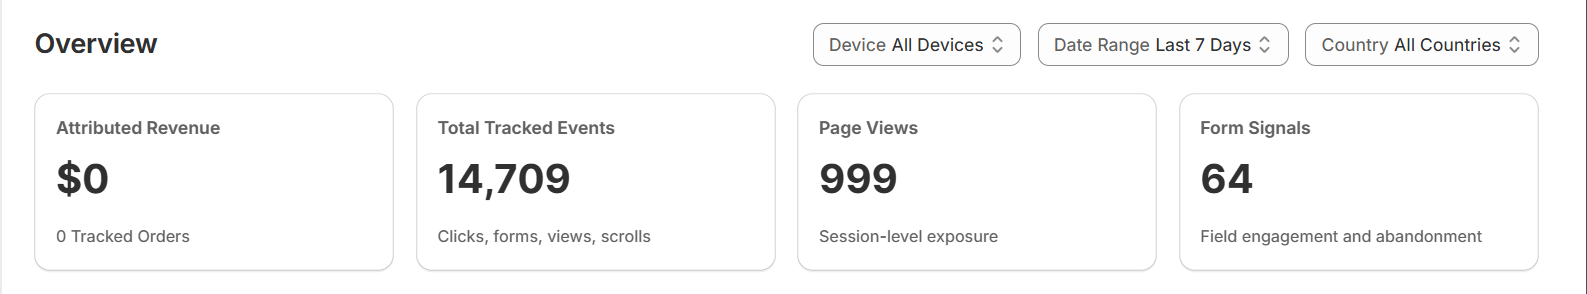
Key Metrics Row
This row gives the fastest high-level summary of store activity.
It includes attributed revenue, total tracked events, page views, and form signals, so users can quickly understand traffic volume and engagement quality.
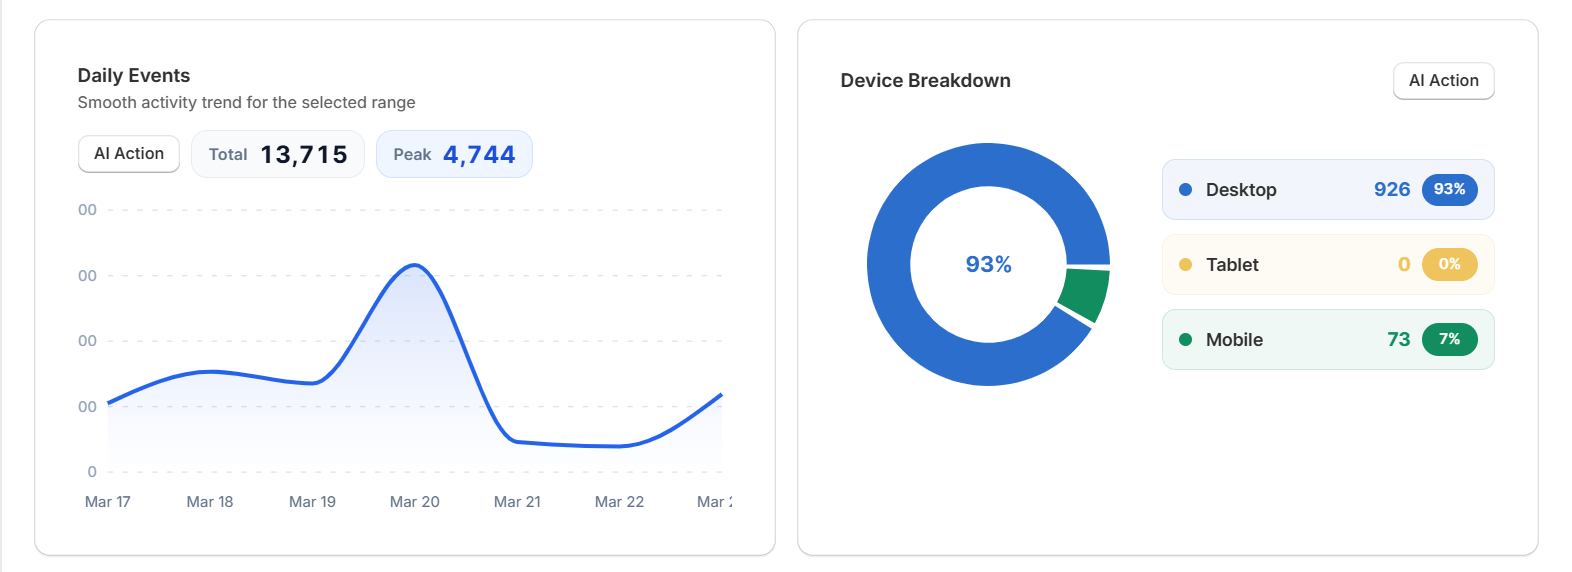
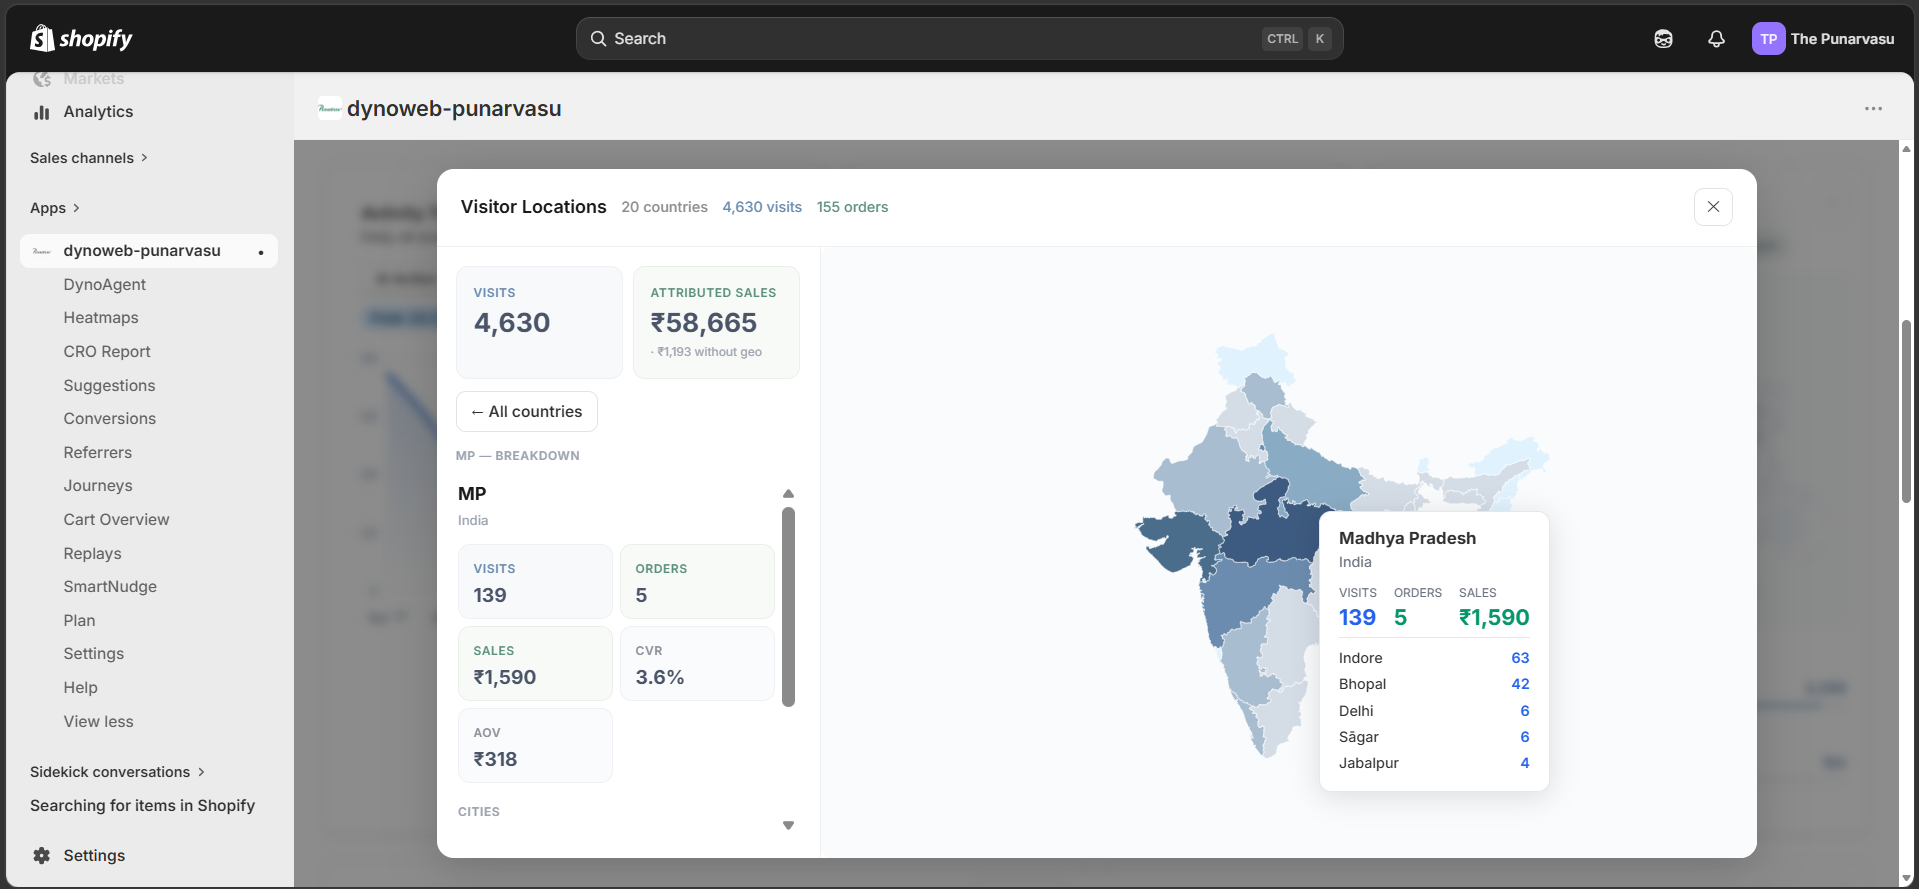
Activity Overview Row
This row helps users understand how traffic is behaving over time, how it is distributed across devices, and where it is coming from geographically.
The left chart shows the daily activity trend, the middle chart shows the device breakdown across desktop, tablet, and mobile, and the map component on the right shows visitor locations by country with drill-down details for states, regions, and city-level traffic where available.
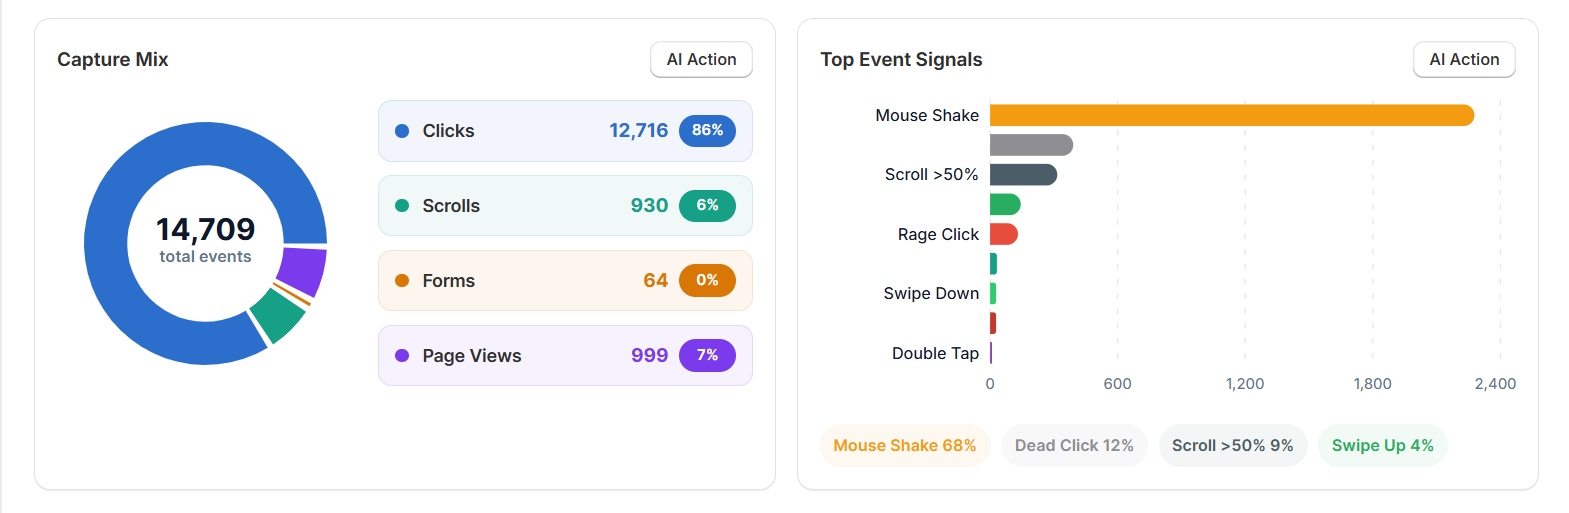
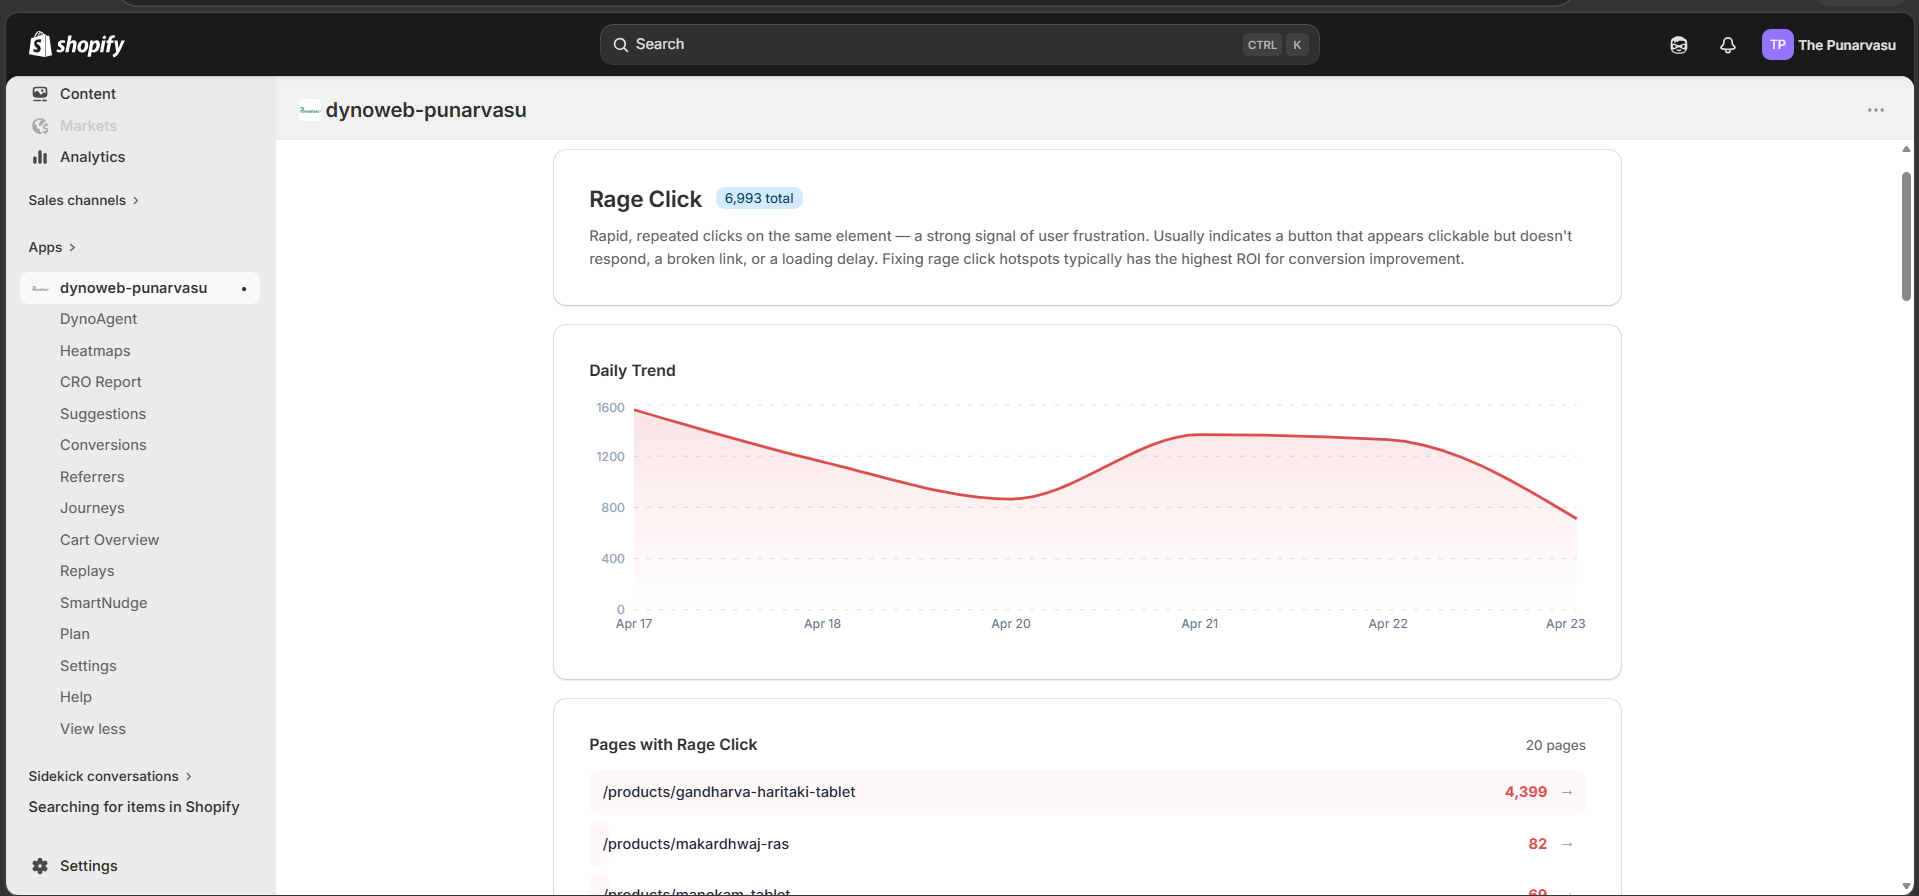
Behavior Signals Row
This row is the signal hub for DynoWeb. It gives a quick read on what the app is capturing right now and points users to the dedicated pages for each behavior signal.
The left chart shows the broader mix of clicks, scrolls, forms, and page views. The right chart highlights the signals that need attention first, like scroll depth, rage clicks, dead clicks, and other friction patterns. Each signal has its own detail page with deeper examples, page-level breakdowns, and recommended next steps.
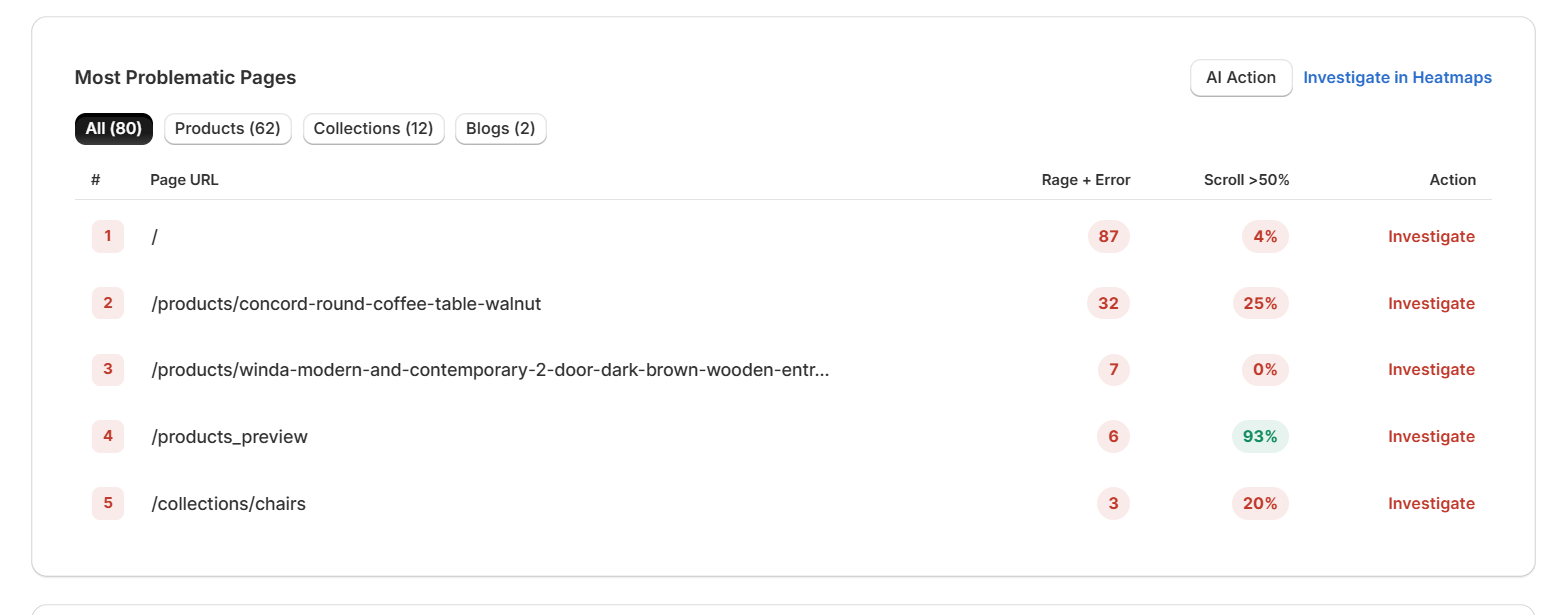
Most Problematic Pages
This table highlights pages that may need attention first.
It surfaces pages with stronger frustration or error signals, and pages where users are not scrolling deeply enough.
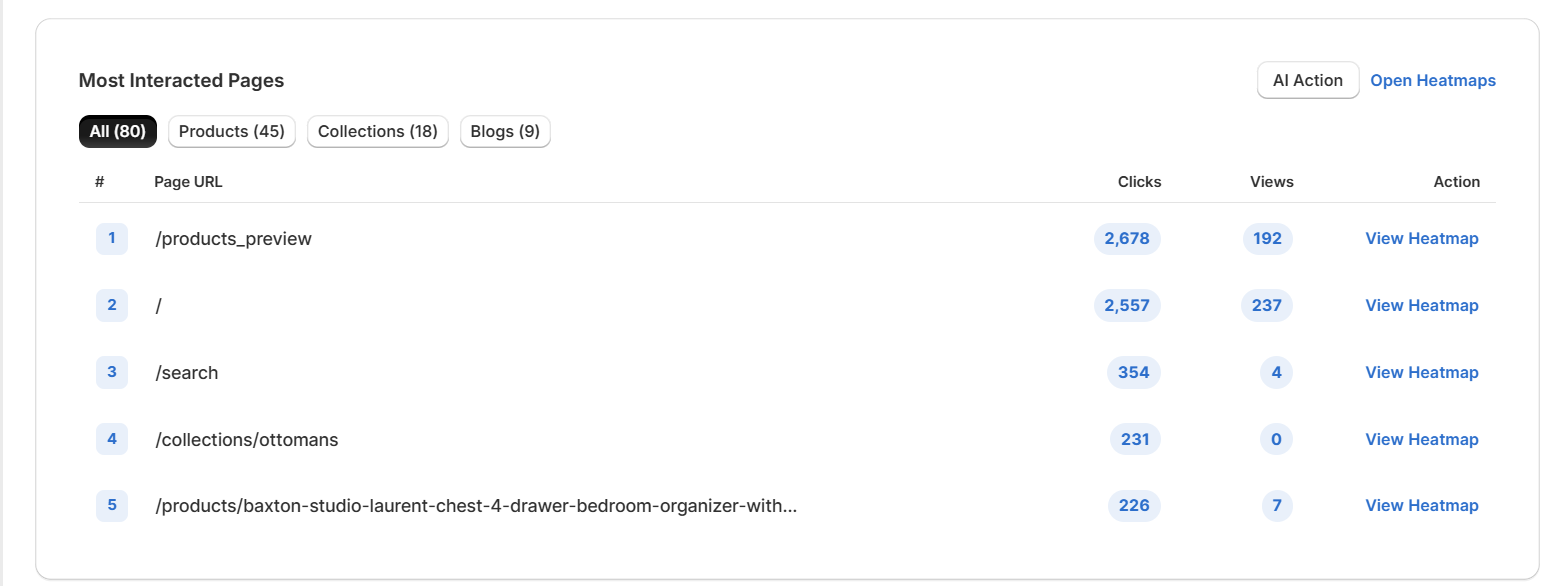
Most Interacted Pages
This table highlights the pages receiving the most engagement, mainly based on clicks and views.
It helps users quickly jump into the pages that matter most.
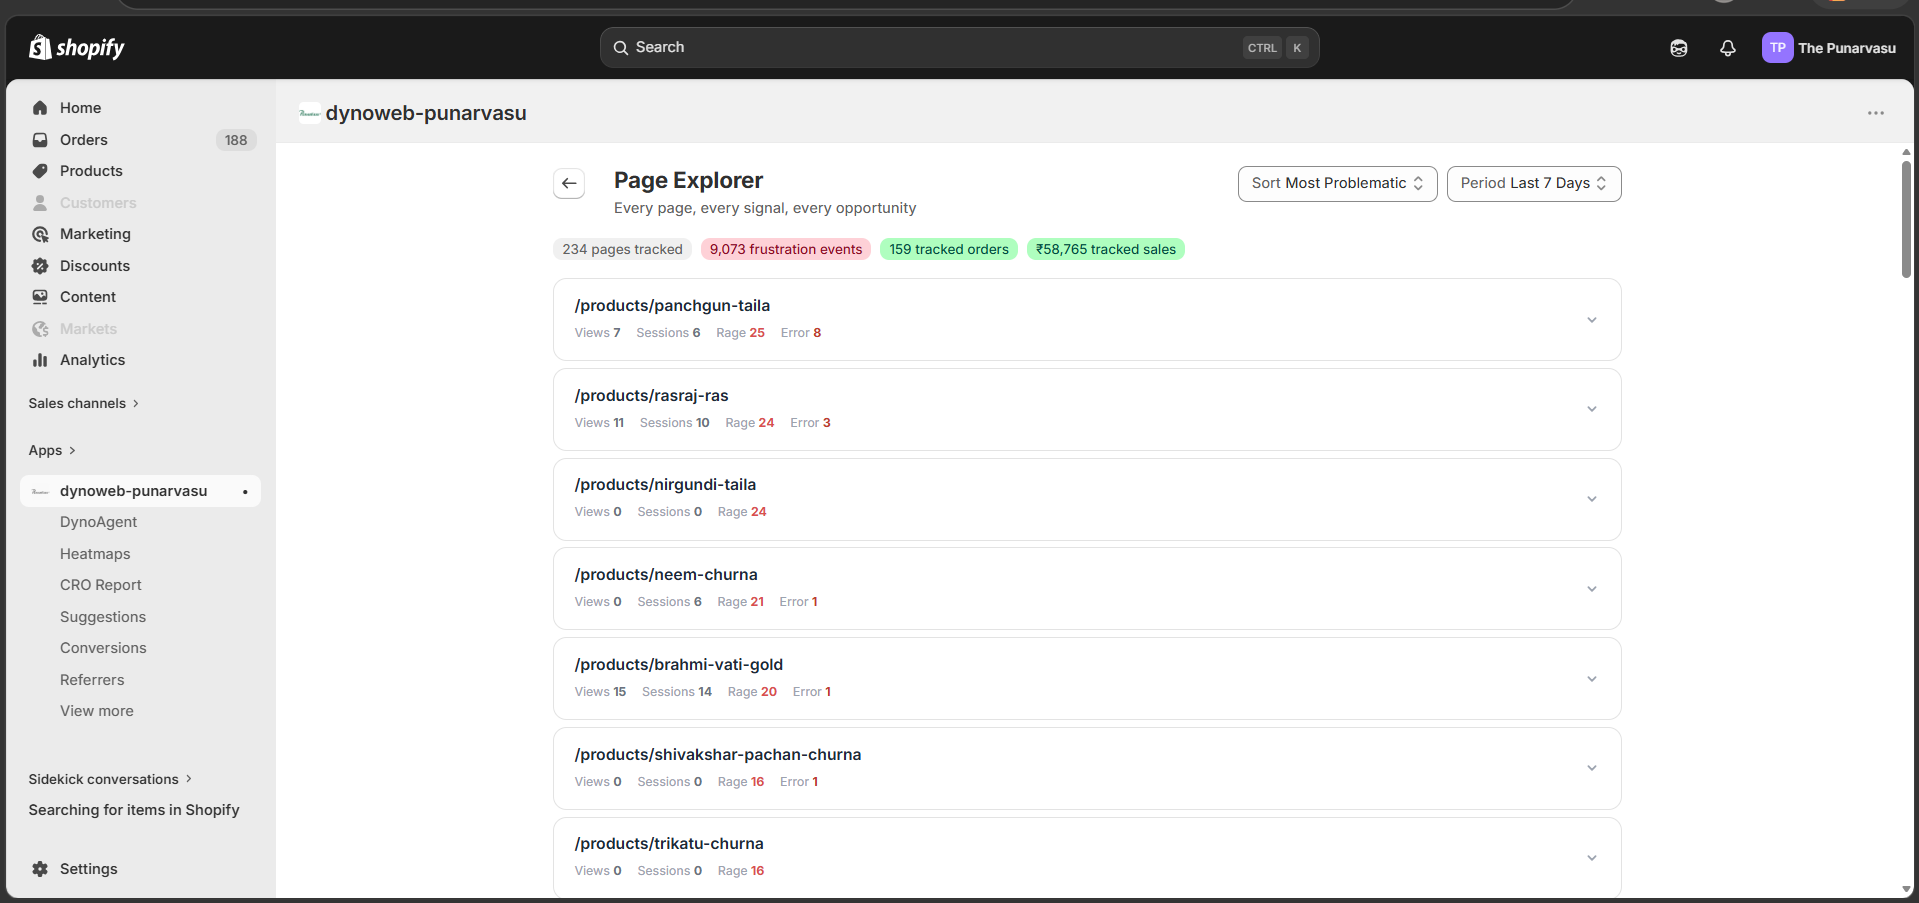
Page Explorer
Page Explorer is the detailed view for every page on your store. It pulls together traffic, engagement, scroll depth, revenue, orders, conversion rate, replay activity, health score, and related suggestions so you can understand the full performance picture in one place. Use it to sort by traffic, revenue, or problem severity, compare pages side by side, and identify which pages need attention first.