Journeys
Understand how Journeys shows where storefront sessions begin, where they drop off, and which paths visitors take most often.
The Journeys page helps users understand how visitors move through the storefront from landing to exit or purchase.
Instead of focusing on a single page, this page focuses on navigation flow: where sessions begin, where they end, and which paths appear most often.
What It Does
Journeys gives users a path-level view of storefront behavior.
It helps answer practical questions like which pages attract visitors first, where sessions are being lost, and which navigation sequences happen most often.
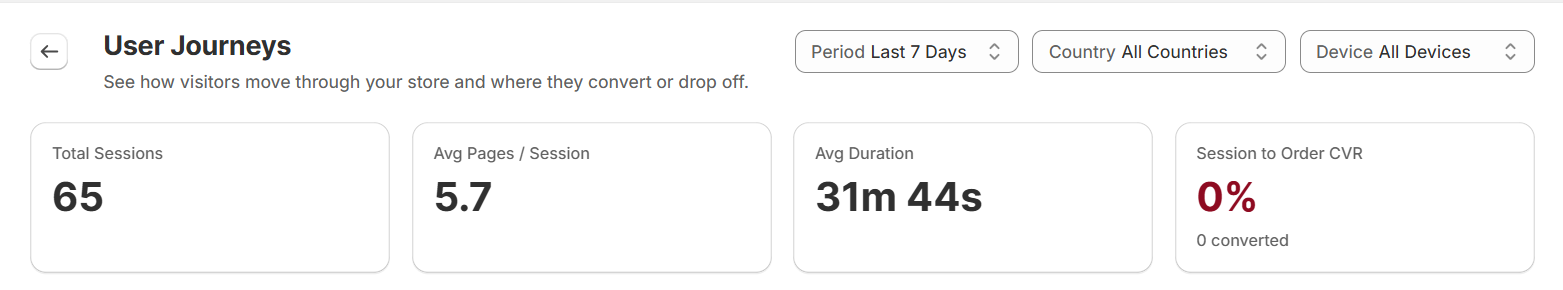
At the top of the page, users can change the period, country, and device filters, then review summary metrics like Total Sessions, Avg Pages / Session, Avg Duration, and Session to Order CVR.
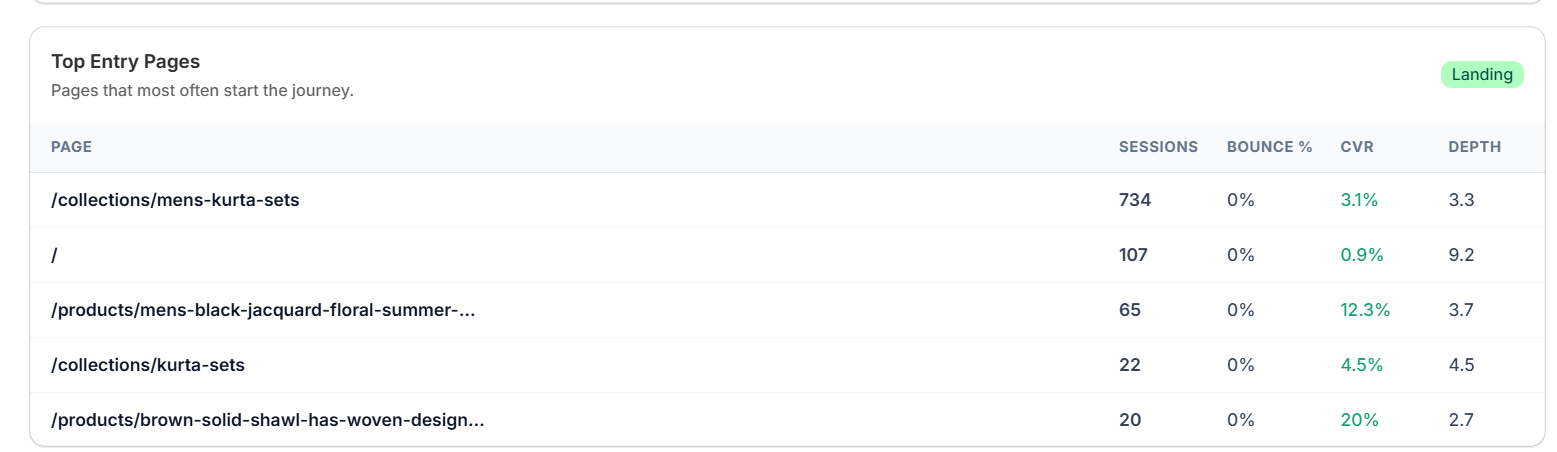
Top Entry Pages highlights the pages that most often start a tracked journey, making it easier to see which landing points are bringing visitors into the store.
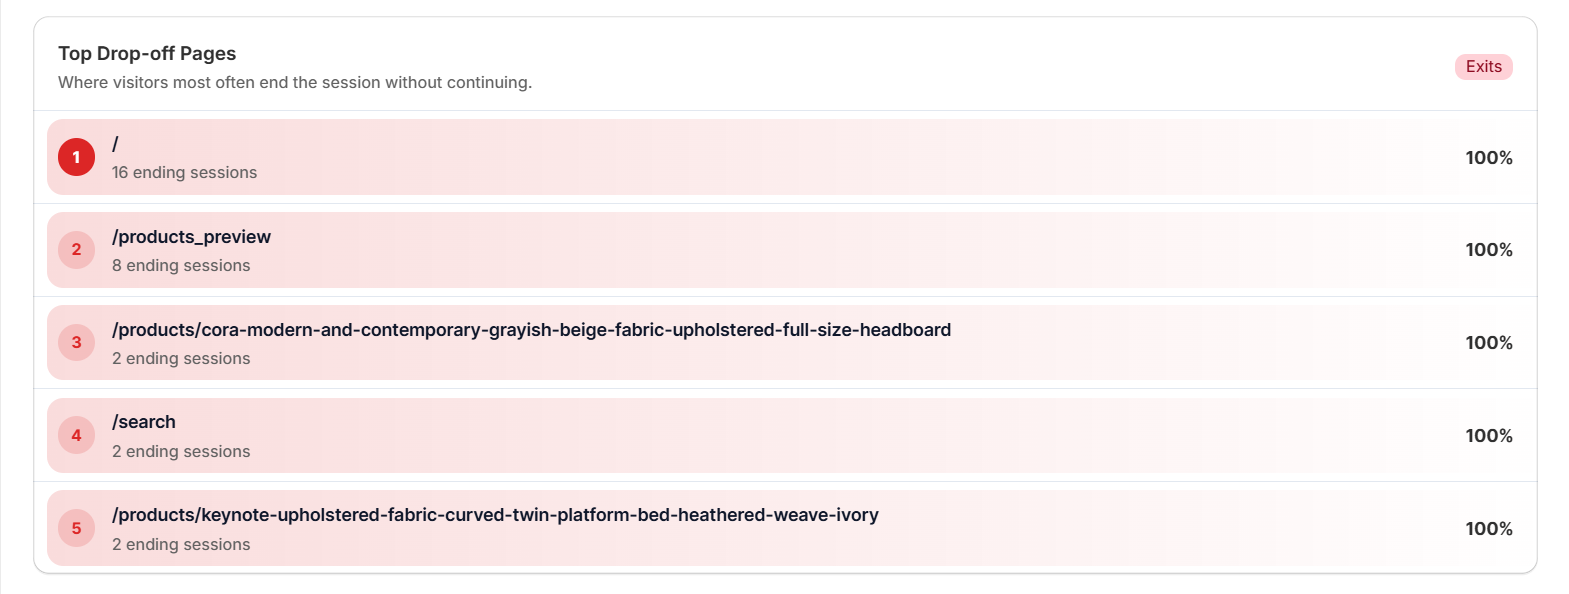
Top Drop-off Pages highlights the pages where sessions most often end, helping users spot leak points, weak handoffs, or pages that may be causing visitors to leave.
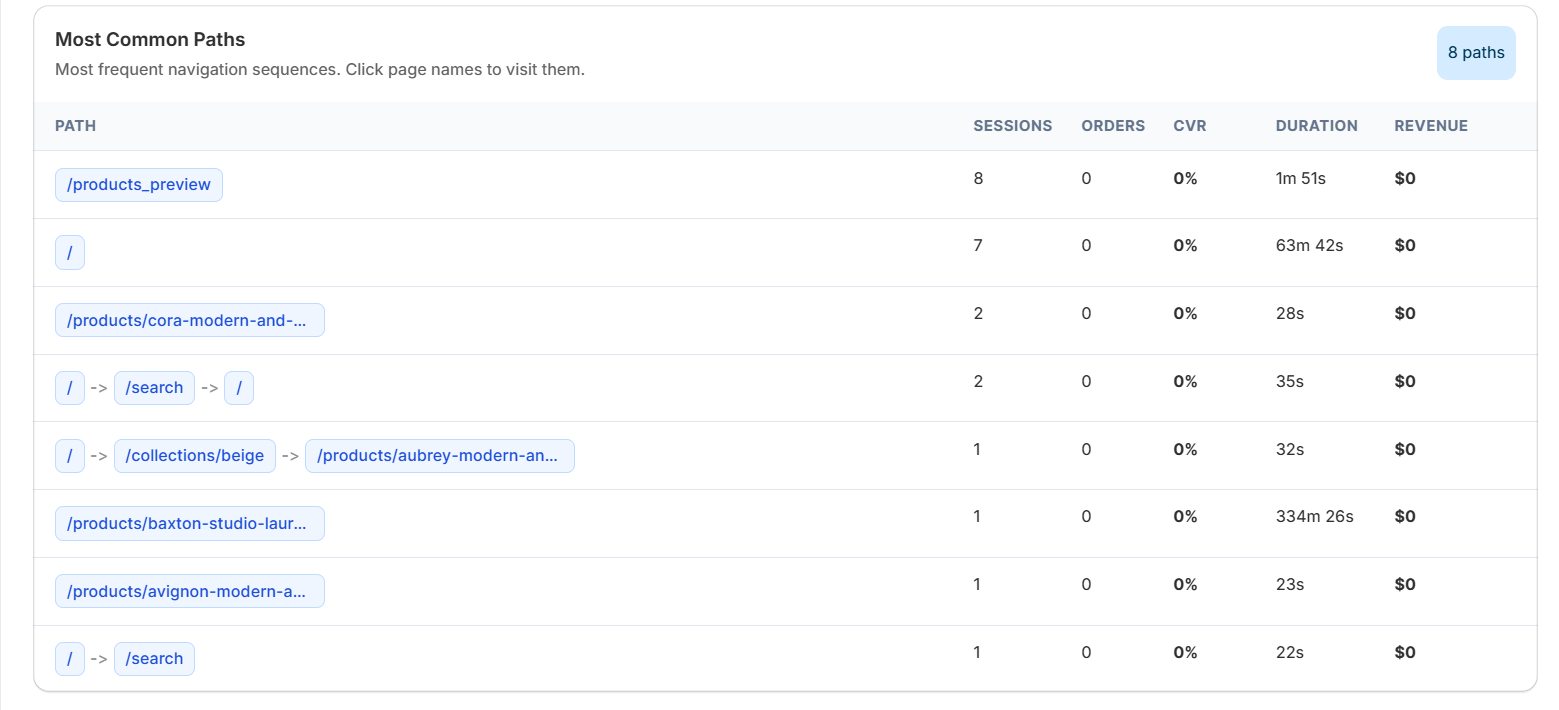
Most Common Paths shows recurring navigation sequences along with sessions, orders, CVR, duration, and revenue so users can compare high-volume paths with high-value paths.
This makes Journeys useful as a bridge between page behavior and full-session movement.
It helps users move from "this page gets traffic" to "this is how visitors actually flow through the store."
Deeper Journey Inspection
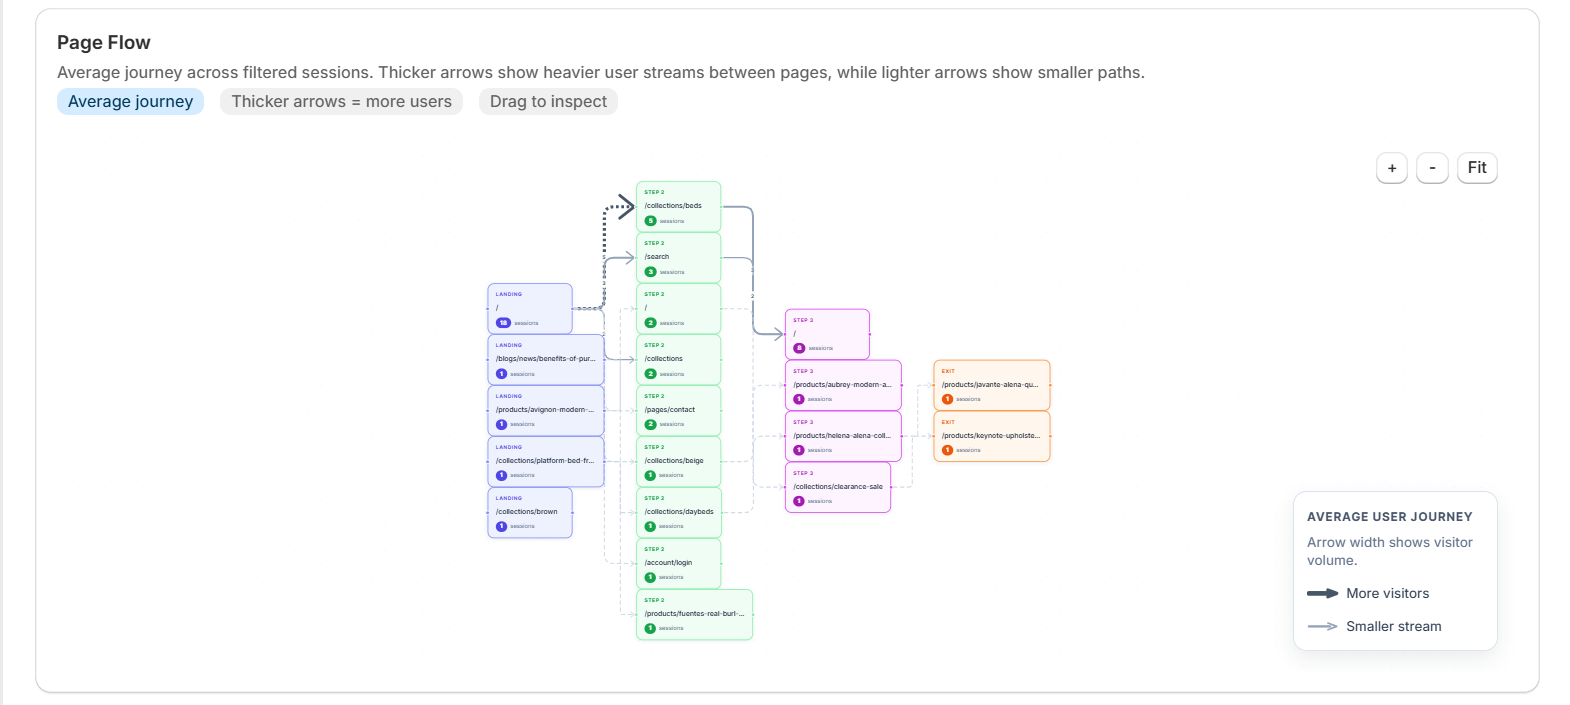
Page Flow gives users a visual map of how visitors move from landing pages through the next steps in the journey.
Thicker arrows represent heavier traffic streams, which makes it easier to spot the dominant paths and where journeys tend to branch or fade out.
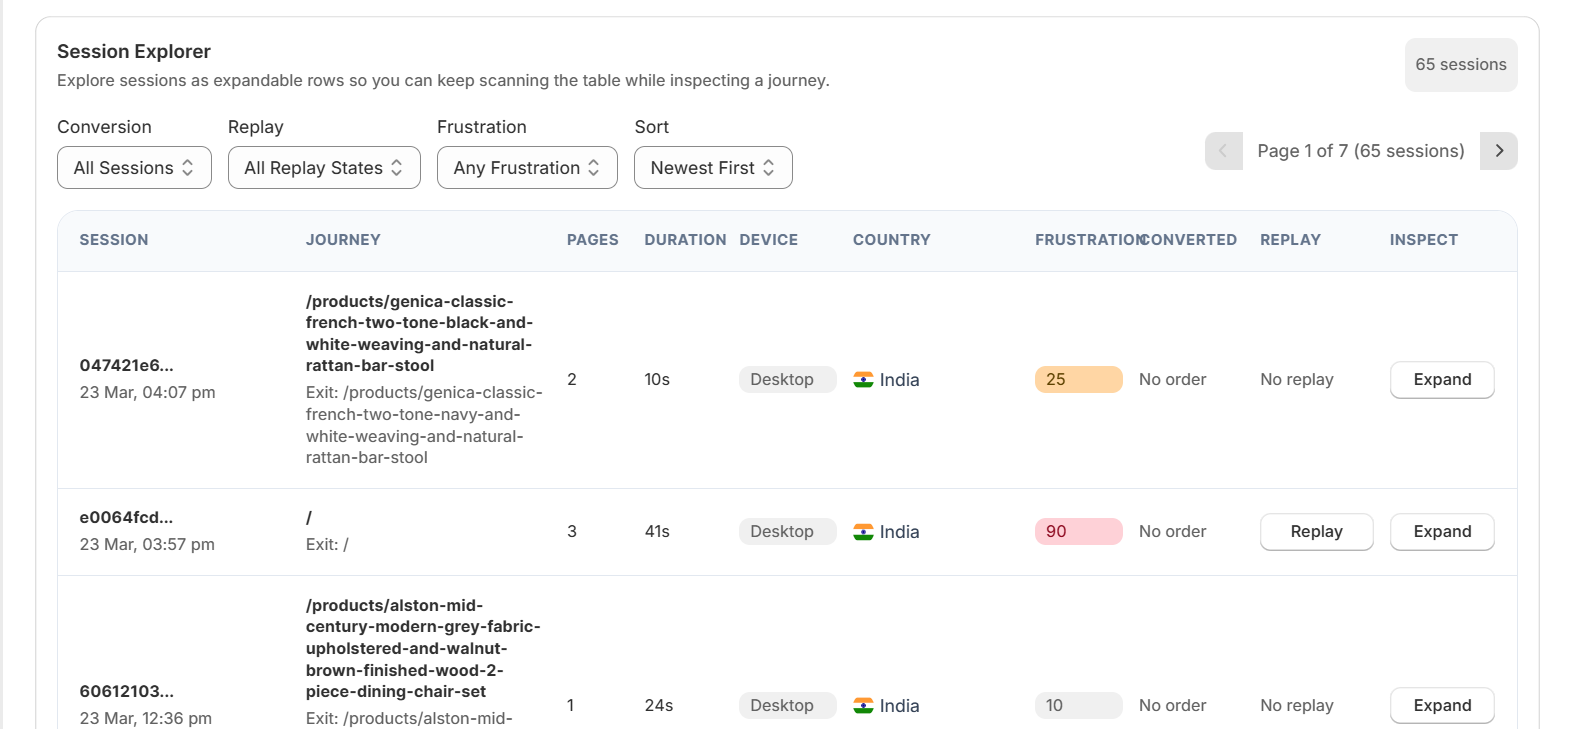
Session Explorer gives users a session-by-session table for inspecting individual journeys in more detail.
It surfaces journey path, page count, duration, device, country, frustration, replay state, and whether the session converted, so users can quickly decide which visits deserve a closer look.
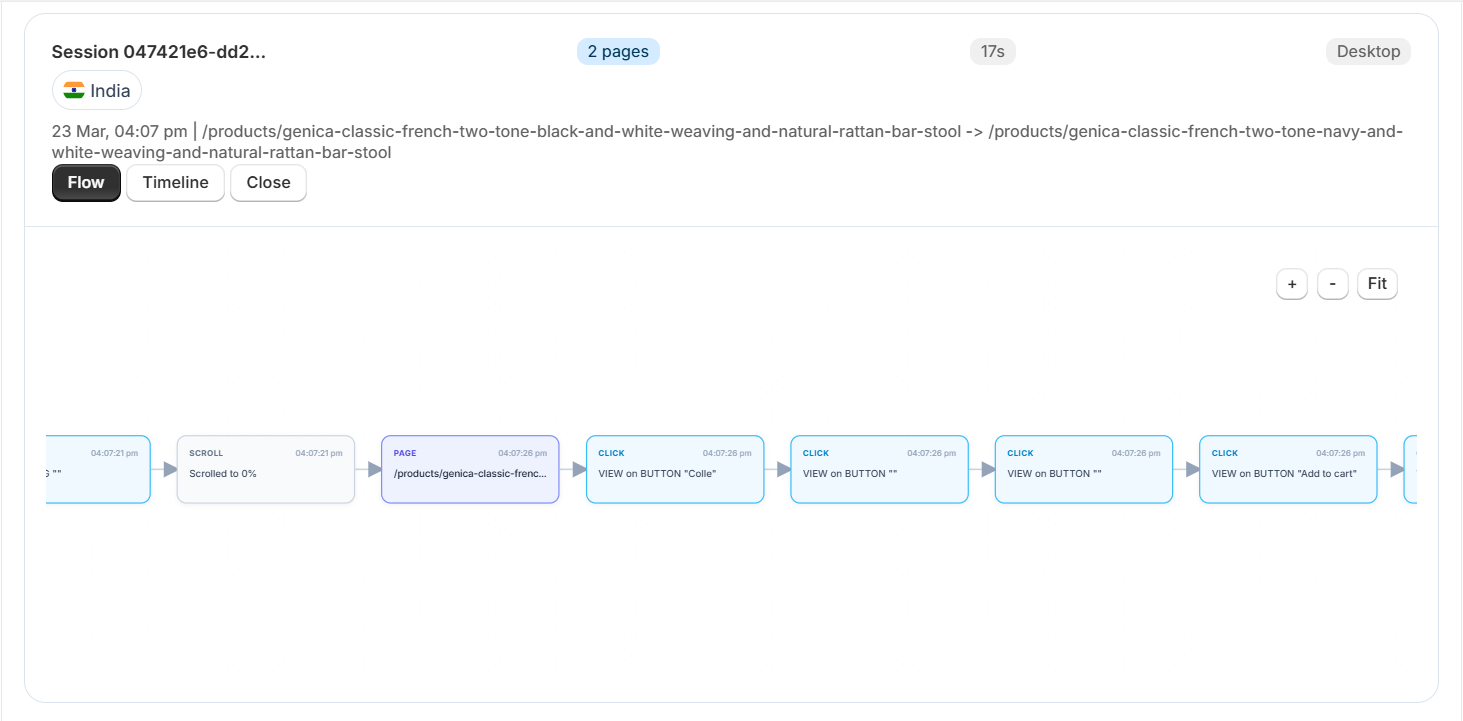
When a user expands a session, they can inspect the step-by-step session flow to see the exact pages and interactions that happened during that visit.
How To Use It Best
The best way to use this page is to start with Top Entry Pages so users can see which landing points deserve the most attention first.
Then they should compare Top Drop-off Pages to find where sessions are ending too early or at unexpectedly high rates.
After that, Most Common Paths helps users understand whether visitors are moving through the store the way the storefront intends, or whether important journeys are breaking down before product discovery, cart, or purchase.
If users need a more visual explanation of how traffic moves, they should open Page Flow to see the dominant journey branches and where the main streams narrow out.
If a specific path looks suspicious, Session Explorer is the best next step because it lets users inspect real individual journeys instead of only aggregated patterns.
When a path looks weak, this page works best alongside Heatmaps, Replays, Suggestions, and Conversions.
Users can investigate the specific page friction in Heatmaps, review what visitors actually did in Replays, check for fix opportunities in Suggestions, and confirm whether the journey leads to revenue in Conversions.
Good Help-Guide Positioning
"Journeys shows how visitors move through the storefront, helping users identify top entry points, major drop-off pages, and the paths that lead to stronger or weaker outcomes."
Previous
Referrers
Understand how Referrers reveals where your visitors come from, which traffic sources drive conversions and revenue, and whether AI shopping engines like ChatGPT, Perplexity, and Google AI Mode can actually find and recommend your store.
Next
Conversions
Understand how Conversions connects storefront interactions to orders and attributed revenue.